I've been thinking about experimentation a lot recently. Our team is spending a lot of effort trying to make Firefox experimentation feel easy. But what happens after the experiment's been run? There's not a clear process for taking experimental data and turning it into a decision.
I noted the importance of Decision Reports in Desirable features for experimentation tools. This post outlines the process needed to get to a solid decision report. I'm hoping that outlining this process will help us disambiguate what our tools are meant to do and identify gaps in our tooling.
So, here are the 5 Stages of Experiment Analysis as I see them:
Build Intuition, Form an Opinion
When I begin reviewing an experiment, I need to get a feel for what's going on in the data. That means I need to explore hypoetheses quickly. Did the number of page loads unexpectedly increase? Why? Did the number of searches unexpectedly stay flat? What are the error bounds?
Consequentially, I need tools that let me iterate quickly. This will help me develop the story I'm going to tell in the final report. Keep in mind, most of what I see during this investigation will not be included in the report; part of telling a good story is knowing what isn't important.
These tools are what most folks imagine when talking about tools for experimentation.
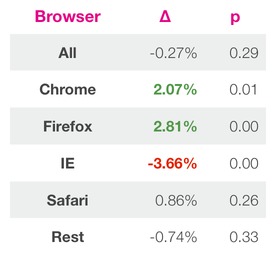
Prominent tools for this stage include the front ends for Google Analytics or Optimizely. Basically, I'm talking about any webpage that shows you statistics like this (from AirBnB's excellent blog):
Some of Mozilla's tools in this category include:
- Test Tube
- Mission Control
- re:dash
Generate Artifacts
Once I have an idea of what's happening in an experiment, I start gathering the important results into a report. It's important to freeze the results I'm seeing and include them in the report. Five years from now, I want to be able to test whether my decision still makes sense. Part of that is deciding whether the data are telling a different story now.
Unfortunately, this process usually looks like copying and pasting tables into a Google Doc or taking a screenshot from re:dash. This works, but it's error prone and difficult to update as we get more data.
The other way this gets done is loading up a Jupyter notebook and trying to reproduce the results yourself. This is nice because the output is generally in a more useful format, but this is clearly suboptimal. I'm duplicating effort by re-implementing our experiment summary tools and creating a second set of possibly inconsistent metrics. It's important that these artifacts are consistent with the live tools.
We don't really have any tools that service this need at Mozilla. In fact, I haven't heard about them anywhere. This always seems to be done via a hodgepodge of custom scripts.
It would be ideal if we had a tool for gathering experiment results from our live tools. For example, we could have one tool that:
- gathers experiment results from re:dash, testtube, etc
- dumps those results into a local (markdown or HTML formatted) text file
- helps a user generate a report with some standard scaffolding
I've been calling this tool an "artifact generator" but it probably needs a better name.
Annotate and Explain
Now we've gathered the important data into a single place. We're not done yet, nobody will be able to make heads or tails of this report. We need to add context. What does this experiment represent? What do these numbers mean? Is this a big change or a small change? Do we just not know? Is this surprising or common? We should include answers to all these questions in the report, as best we can.
This takes time and it takes revisions. Our tools should support this. For example, it should be easy to update the tables generated by the artifact generator without a lot of copy-pasting. It should also be easy to make edits over the course of a week (i.e. don't use a wiki).
The best tool I've seen in this area is knitr,
which supports Rmd report generation.
Jupyter is a prominent contender in this space,
but I usually run into significant issues with version control and collaboration.
LaTeX is a solid tool, but it's a real pain to learn.
Get Review
Before sharing a report every analyst should have the chance to get their work reviewed. Getting review is a critical feature of any data science team. In fact, this is so important that I explicitly ask about review processes when interviewing with new companies. Review is how I learn from my peers. More so, review removes the large majority of the stress from my daily work. I find my confidence in reviewed work is dramatically higher.
Again, this portion of the toolchain is fairly well supported. Any code review tool will do a reasonably good job. Filing a PR on GitHub is the canonical way I get review.
Publish and Socialize
Finally, I need to share my final report. This should be simple, but I've found it to be difficult in practice.
There's as many options for publishing reports as there are stars in the sky. Basically any content management system qualifies, but few work well for this task. I've seen companies use wikis, public folders on a server, ftp, Google Docs, emailed .docx files, ... All of these options make it difficult to get review. Most of these options are a discoverability nightmare.
At Mozilla, we've been using AirBnB's knowledge-repo to generate RTMO. It does a reasonably good job, but doesn't give the analyst enough control over the format of the final report. I'm working on a replacement now, called Docere.
Where to go next
In summary, we already have pretty good tools for annotating reports and getting review. I think we at Mozilla need to work on tools for generating experiment artifacts and publishing reports. I think we need to continue working on tools for building intuition, but we're already working on these tools and are on the right track.
This doesn't solve the whole problem. For one, we still need a process for making a decision from these decision reports. Having a well reasoned argument is only part of the decision. Who makes the final call? How do we guarantee we're our decision making is consistent? This process also ignores building a cohesive style for reports. Having consistent structure is important. It gives readers confidence in the results and reduces their cognitive load.
I think this is a good start though.