I got caught giving some bad advice this week, so I decided to share here as penance. TL;DR: Probabilistic counts are great, but they shouldn't be used everywhere.
Counting stuff is hard. We use probabilistic algorithms pretty frequently at Mozilla. For example, when trying to get user counts, we rely heavily on Presto's approx_distinct aggregator. Roberto's even written a Presto Plugin and a Spark Package to allow us to include HyperLogLog variables in datasets like client_count_daily.
These algorithms save a lot of compute power and analyst time, but it's important to remember that they do introduce some variance.
In fact, the error bars are substantial.
By default, Presto's approx_distinct is tuned to have a standard error of 2.3%,
which means one out of every three approx_distinct estimates
will be off by more than 2.3%.
I can set a tighter standard error by passing a second parameter,
but it
looks like
I can't request anything below 0.5%.
For our HLL datasets, we set a
default standard error
of 1.63%, which is still significant.
Unfortunately, we can't get the standard error to be much smaller than 1%. Databricks has a writeup here which explains that the compute time for their probabilistic estimate starts to be greater than the compute time for an exact count somewhere between an error of 0.5% and 1.0%.
Most of the time, this isn't an issue. For example, if I'm trying to count how many clients used a Container Tab yesterday I don't care if it's 100mm or 105mm; those numbers are the same to me. However, that noise becomes distracting if I'm building a dashboard to track year over year change.
An example
I put together an
example notebook
to explore a little.
I created a toy dataframe containing
7 days of data and 1000 client_id's per day.
Then I got an approximate count of the clients for each day.
Here's what an arbitrary set of daily errors look like:
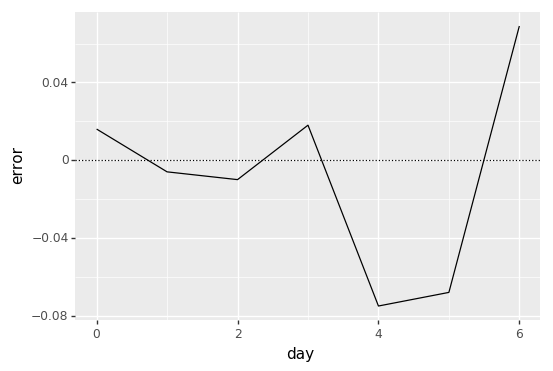
By default, pyspark's
approxCountDistinct
aggregator has a relative standard deviation (rsd) of 5%!
The maximum error magnitude we see in this dataset is 7.5% (day 4).
In my opinion, Spark's documentation obfuscates the real interpretation
of this rsd value, calling it the: "maximum estimation error allowed".
In reality, there is no "maximum error" allowed.
The rsd is a standard deviation for an approximately normal distribution.
Roughly one in three errors are going to be bigger than the rsd.
What's worse is that this graph makes us think there's movement in this metric over time. In reality, the user count is perfectly flat at 1000 users every day. Since these errors aren't correlated over time, we see big day over day swings in the estimates. The largest swing occurs from day 6 to day 7 where the user count jumps by 13.7% (-6.8% to 6.9%)!
Conclusion
So what's the take away?
Probabilistic counts are still super useful tools,
but it's important to consider what kind of error they're going to introduce.
In particular, don't use probabilistic counts (like approx_distinct)
when looking at year over year rates or plotting trend lines.